Project tracking indicators: The tutorial for analyzing project performance
How can you determine whether your projects are on track or at risk of failure? This is impossible without reliable tracking indicators. This is all the more important given that only 29% of projects succeed. To avoid failure, tracking indicators are essential. Without them, you risk sailing blindly ahead, causing frustration, wasting time, resources and stakeholder confidence.
However, due to a lack of time, resources, project management skills or an underestimation of their importance, many projects are launched without clearly defined monitoring indicators.
In this article, you'll find tips, examples and tools to help you choose the right monitoring indicators and improve the performance of your projects.
What are project monitoring indicators?
Project monitoring indicators, also known as Key Performance Indicators (KPIs), are essential tools for assessing project effectiveness. They provide concrete measures of performance, enabling project managers and teams to make informed decisions.
💡Toremember: project monitoring indicators are used to measure the performance and effectiveness of the various facets of a project.
They are key tools for :
- measure and monitor progress against targets,
- detect any discrepancies,
- make informed decisions to ensure project success.
What are the different types of project indicators?
Although there are a large number of different indicators, and they need to be adapted to your sector, your structure and your projects, they can be grouped into 4 main categories.
- Cost indicators: These are used to check that the project remains within budget. They are vital for maintaining profitability and financial efficiency.
- Deadline indicators: These ensure that the project is on schedule. Meeting deadlines is often as important as the quality of the work delivered.
- Quality indicators: They assess the conformity of the work carried out in relation to defined standards and requirements. Quality is a direct reflection of project value.
- Efficiency indicators: These measure the optimal use of resources, whether budgetary, human or time-related.
How to define effective monitoring indicators?
To create effective performance indicators that measure progress and detect deviations from objectives, follow these principles:
- Achievable: Set realistic, achievable objectives, adapted to your context.
- Linked to Objectives: Make sure that each indicator is directly linked to a specific project objective.
- Measurable and continuously monitored: Your indicators must be quantifiable, precise and regularly monitored.
- Temporal: They must have a defined deadline for effective follow-up.
- Understandable: They must be simple and clear for all stakeholders.
- Decision-focused: Choose indicators that facilitate decision-making.
- Customized: Tailor your indicators to the specific needs of your team and your project.
- Realistic: Focus on relevant objectives and avoid dispersion.
- Specific: Define your objectives as precisely as possible.
Case study: Key KPIs used by Bornes Solutions to measure project performance
With the Project MonitorBornes Solutions was able to put in place an entire data infrastructure enabling it to monitor and control projects in a very detailed way.
Interpretation of the data has enabled the creation of key project performance indicators such as :
- Average project duration
- Number of projects managed per project manager
- Number of projects by type
- Identifying project complexity

What's the difference between project analysis and project portfolio analysis?
Project performance
Project analysis focuses on the detailed assessment of an individual project.
Project analysis generally aims to
- assess its feasibility,
- estimate the resources required,
- identify risks,
- define measures to achieve specific project objectives.
Project portfolio performance
While project portfolio analysis takes a broader, strategic perspective by evaluating a set of projects and their interactions, project portfolio analysis aims to :
- make informed decisions on resource allocation,
- assess the portfolio's overall performance,
- identify potential synergies between projects,
- align the portfolio with the organization's strategic objectives.
How to create a project performance chart?
To analyze the performance of your projects, you'll need to set up a project performance monitoring dashboard.
If you work in project portfolio mode, project portfolio management software will come in very handy!
Creating a project performance chart requires advance planning, selection of appropriate indicators, regular data collection, analysis of results and effective communication with stakeholders.
Before embarking on the creation of a performance chart, ask yourself what its purpose is.
- What type of employee is the table intended for? Is the table intended for operational monitoring (project managers) or strategic monitoring (codir members)?
- What indicators are useful for governance bodies?
- What indicators are useful for analyzing results?
- How do you measure return on investment?
- How will the results be communicated?
Here are some tips for creating your performance chart:
1. Identify the stakeholders involved
Anticipate the communication of results. A performance chart is first and foremost a tool to help you analyze and communicate.
2. Define performance targets
Identify the specific objectives you wish to measure in order to assess project performance. As seen below, performance criteria are generally based on cost, schedule, performance and quality objectives. Percentages of completion and deviation from target objectives are then defined.
3. Set targets or thresholds
For each indicator, you need to evaluate the situation at the start of the project and the one you expect at the end. These values will help you create success criteria. You'll be able to analyze whether the project's results are in line with expectations, or whether they require corrective action!
4. Organize data in a table
Create a table highlighting each performance indicator. Fill in the table by entering the actual data for each performance indicator. You can also include formulas to calculate deviations from established targets or thresholds. Examples of indicators :
5. Communicate results visually
You will use the report to generate reports or visual graphics to communicate results to project stakeholders. Make sure you present the information in a clear and understandable way. Some project portfolio management software, such as Project Monitor, can generate slideshows for you, or be coupled with BI tools.
💡 The portfolio review committee plays a crucial role in project monitoring. In Project Monitor, several features are available to facilitate this monitoring:
- Dashboard You can set up a project dashboard in Project Monitor, sorted, for example, by project manager. Each project manager will be able to present indicators to the relevant people, view the latest flash report for each project, and complete a new report - all without having to switch pages. This provides a clear, concise overview of the status of each project, and enables effective collaboration between committee members.
- Report schedule The schedule report allows you to visualize the timing of management projects in relation to each other. This feature gives you a chronological view of projects, making it easier to manage dependencies, identify potential conflicts and adjust priorities if necessary. So you can make informed decisions about the scheduling of projects in your portfolio.
- Portfolio slideshow The portfolio slideshow takes the form of a PowerPoint presentation, with configurable indicators and graphs. Each slide is dedicated to a specific project, highlighting its key indicators and graphs. The review report can be completed by project, consolidated for the whole portfolio, and then shared with participants by e-mail. The result is a visually appealing, personalized presentation of important information for the review committee.
With the various functionalities offered by Project Monitor, you have powerful tools at your disposal to effectively monitor and present the status of your project portfolio at review committee meetings. These features help you to centralize information, facilitate collaboration and make informed decisions to ensure the success of your project portfolio.
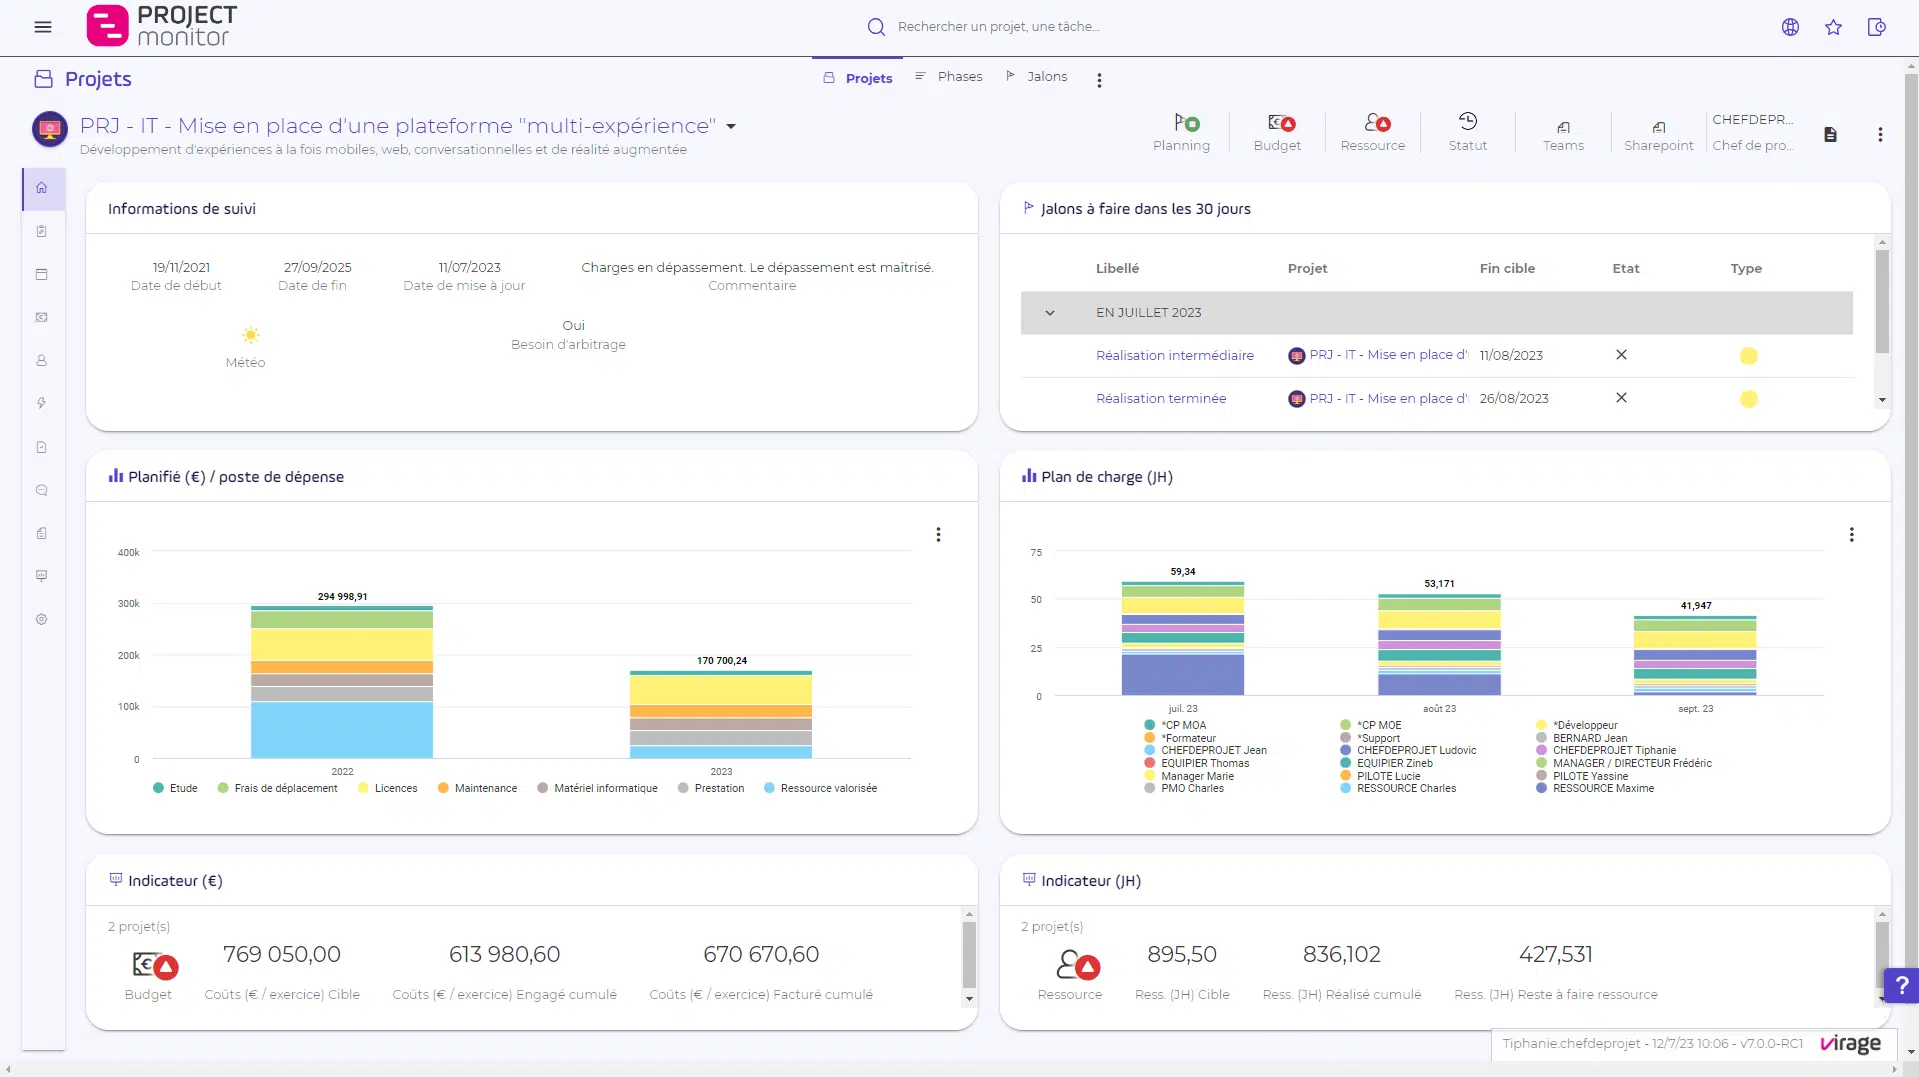
Example of a project analysis dashboard
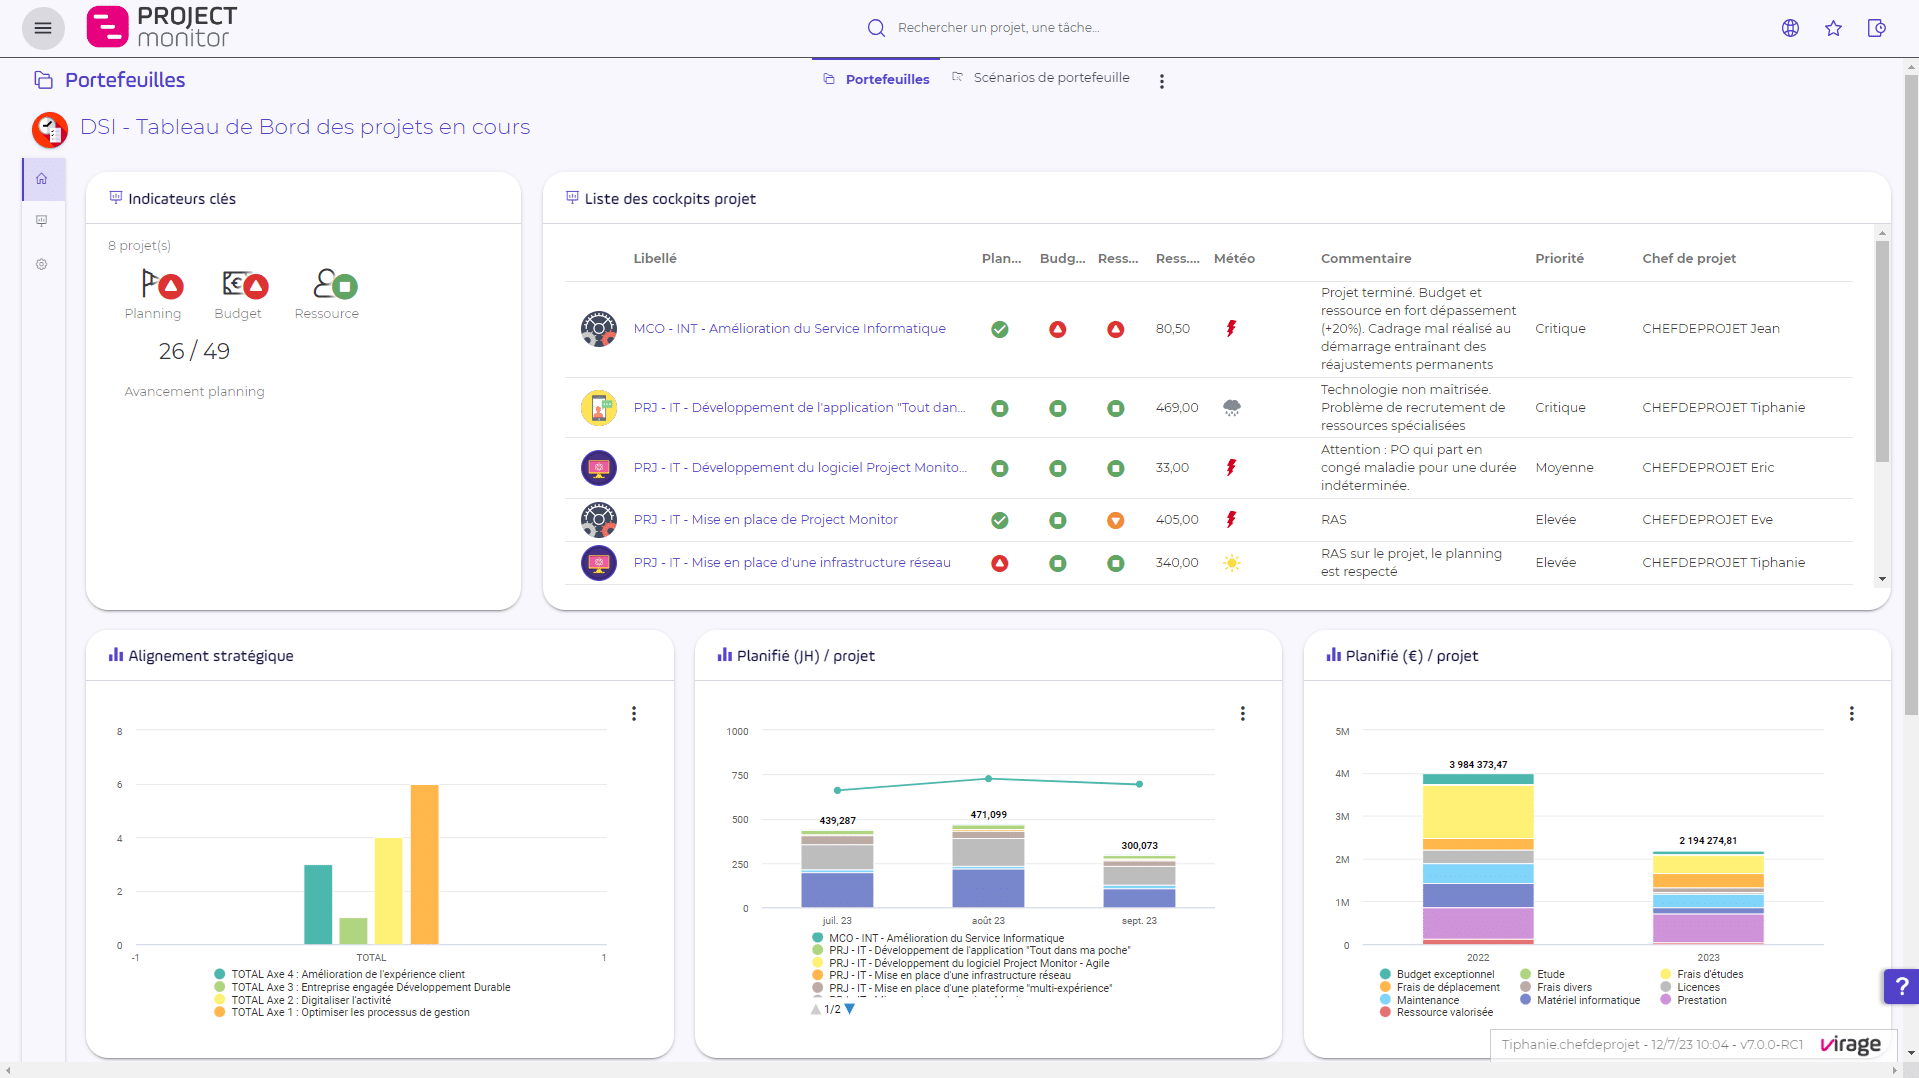
Example of a project portfolio analysis dashboard
Discover Project Monitor software to evaluate your project performance!
Project Monitor 's reporting tools and dashboards provide you with analytical reports on your organization's activities and results. These decision-making tools transform your data into usable information. They are an essential part of your regular project management reviews.
With Project Monitor you can :
- Define key indicators for managing your project portfolios (risk, resources, schedule and budget)
- Manage your portfolios with customized dashboards
- Animate governance bodies in collaborative mode using interactive reports and web slideshows
Optimized project & portfolio management, for the success of your projects
Dashboards, calculated in real time, offer all key project indicators:
Get a 360° view with dashboards
Analysis of your project portfolio is facilitated by all project themes, business indicators and project KPIs. They provide a single or multi-project view, with quantitative and qualitative data.
Update your projects live
Reports enable real-time integration of reporting data into your personalized dashboard. Then animate your portfolio reviews from the dashboards and integrate your decisions.
Find out how to keep track of your projects with Project Monitor
Let's build your vision together now and choose the software that's right for you.
What are the main features?
What integration options are available?
Read more
Does our software meet your needs?
- Let's take a quick 15-minute look at your desired functionalities!
- And get the link to our demonstration video